As stated in the press release published by Eurogas at the time, the economic crisis (with a drop of 4.1% in the EU's GDP) had a decisive influence on demand for natural gas, in particular in the Industrial market, and also electrical generation.
In the final part of the year the easing of the economic downturn within the EU led to a lesser contraction in demand for natural gas. This situation was accompanied by a very harsh month of December in climatic terms, serving to increase demand for gas in the residential market.
We below highlight certain features of the main countries of the European Union in terms of their gas demand.
The United Kingdom remains the largest natural gas market, with 1004.9 TWh. Last year consumption there fell by 7.8%. All sectors registered a downturn, with the most severe being seen in the industrial market, which shrank by 17%. Demand on the electrical generation market dropped by 7%, a similar figure to that seen in the residential market. Natural gas output continued the downward trend of recent years, dropping by 14% in 2009.
In Germany, demand for gas stood at 875.1 TWh, a figure 4.8% down on 2008. As in the United Kingdom, the main reason for this negative trend was the economic downturn.
Consumption on the industrial and electrical markets fell by 11% in both cases. There was a 3% upturn in the residential market as a result of a colder first quarter in 2009 than the previous year.In Italy gas sales fell by 8% in 2009. It should be pointed out that in the final quarter demand for gas rose, reversing the negative trend seen since October 2008.
Natural gas consumption in France declined by 3% in 2009, the same percentage as seen in the industrial market. The domestic/commercial market meanwhile also registered a very similar drop.
Among the major European consumers, the Netherlands saw the smallest decline in gas demand: 0.7%. One of the reasons for this was a 7.2% increase in the residential market as a result of lower temperatures than those registered in 2008.
- United Kingdom
- Germany
- Italy
- France
- Netherlands
- Spain
- Belgium
- Romania
- Poland
- Hungary
- Czech Republic
- Austria
- Slovakia
- Denmark
- Finland
- Portugal
- Ireland
- Greece
- Lithuania
- Bulgaria
- Latvia
- Luxembourg
- Slovenia
- Sweden
- Estonia
- TOTAL UE 27
- 1.090,0
- 919,4
- 898,5
- 516,9
- 448,4
- 448,9
- 192,7
- 164,3
- 149,1
- 136,5
- 93,0
- 90,8
- 57,9
- 60,0
- 52,9
- 49,9
- 44,6
- 45,1
- 33,4
- 30,3
- 17,4
- 14,4
- 10,6
- 10,8
- 10,9
- 5.586,7
- 1.004,9
- 875,1
- 827,0
- 501,3
- 445,4
- 401,5
- 188,9
- 158,9
- 120,8
- 117,8
- 91,3
- 86,1
- 55,3
- 53,8
- 51,4
- 45,0
- 42,9
- 37,9
- 28,0
- 23,7
- 15,7
- 14,7
- 14,0
- 10,2
- 9,2
- 5.220,8
- -7,8
- -4,8
- -8,0
- -3,0
- -0,7
- -10,5
- -2,0
- -3,3
- -19,0
- -13,7
- -1,8
- -5,2
- -4,5
- -10,3
- -2,8
- -9,8
- -3,8
- -16,0
- -16,2
- -21,8
- -9,8
- 2,1
- 32,1
- -5,6
- -15,6
- -6,5
Source: Eurogas
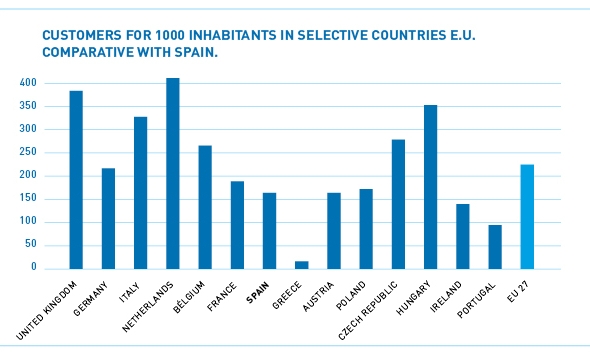
España ha registrado en 2009 un descenso de las ventas del 10,5%, cuatro puntos negativos por encima de la media comunitaria. Entre las razones de esa mayor caída se encuentran el hecho de que en España el peso del sector residencial es bastante menor que en la media de la Unión Europea viéndose, por tanto, relativamente más afectada por las crisis en el Mercado industrial.
El mercado español es el sexto en importancia de la Unión Europea y 2,1 veces más grande que el mercado belga, el siguiente en el ranking.
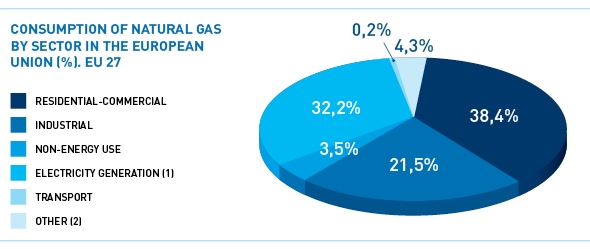
- Residential-Commercial
- Industrial
- Non-energy use
- Electrical generation (1)
- Transport
- Other (2)
- TOTAL
- 39,8
- 25,1
- 3,7
- 25,9
- 0,1
- 5,3
- 100,0
- 38,9
- 24,9
- 3,3
- 27,3
- 0,1
- 5,5
- 100,0
- 39,9
- 24,5
- 3,2
- 28,3
- 0,1
- 4,0
- 100,0
- 40,5
- 22,8
- 3,2
- 29,1
- 0,1
- 4,3
- 100,0
- 39,8
- 21,7
- 3,4
- 29,8
- 0,1
- 5,1
- 100,0
- 40,2
- 20,9
- 3,2
- 30,9
- 0,1
- 4,6
- 100,0
- 38,4
- 21,5
- 3,5
- 32,2
- 0,2
- 4,3
- 100,0

(2) Consumption by energy sectors and leakage.
Source: Energy. Yearly Statistics 2007. Eurostat. European Communities. Luxembourg. 2009. Prepared by Sedigas.


-
 BBG-EVE
 -
 INTERNATIONAL GAS UNION

