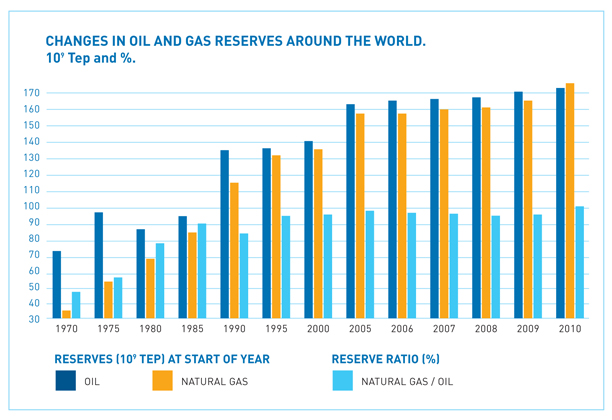
As in the case of oil, the region which has seen the greatest increase in its gas reserves was Asia/Oceania, where total proven natural gas reserves grew by more than 25%. A new audit of figures for Australia (obtained from Geoscience Australia), increased the figures for the previous year by a factor of 2.6. The country now holds the fourth-largest resources of gas in the world.
- North America
- Central & South America
- OECD-Europe
- Eastern Europe and CIS
- Africa
- Middle East
- China and India
- TOTAL
- 9,4
- 1,9
- 3,6
- 12,5
- 3,8
- 6,6
- 1,6
- 39,4
- 8,5
- 2,4
- 4,1
- 24,2
- 5,2
- 15,3
- 3,4
- 63,1
- 8,0
- 4,4
- 3,9
- 31,6
- 5,7
- 18,5
- 4,8
- 76,9
- 8,4
- 5,4
- 5,7
- 38,0
- 5,9
- 25,9
- 7,0
- 96,3
- 7,5
- 6,9
- 5,5
- 52,5
- 8,5
- 37,8
- 10,6
- 129,3
- 6,5
- 7,8
- 6,2
- 58,9
- 9,9
- 44,7
- 13,1
- 147,1
- 6,5
- 7,7
- 8,1
- 52,7
- 11,4
- 54,7
- 11,9
- 153,0
- 7.0
- 7,4
- 6,5
- 53,7
- 14,1
- 72,5
- 13,9
- 175,1
- 8,4
- 7,7
- 6,2
- 53,9
- 14,6
- 73,9
- 15,5
- 180,0
- 9,2
- 7,9
- 6,1
- 54,2
- 14,8
- 75,2
- 16,4
- 183,7
- 9,5
- 7,9
- 6,0
- 58,9
- 14,8
- 77,1
- 20,5
- 194,7
Source: CEDIGAZ y Oil and Gas Journal. Prepared by Sedigas.
By geographical area, of the 194.7 trillion (1012) m3 estimated proven reserves, almost 40% are in the Middle East; 30.3% lie within the territory of the CIS, in particular Russia, with 23% of world reserves, and 20% in Asia/Oceania. Alongside North America (in this case directly linked to an increase in non-conventional gas), these were the only geographical areas to record an increase in reserves. In fact North America now has gas reserves which are even greater than those recorded in 1970, following 40 years of intense levels of output and consumption.
The Russian Federation (estimated reserves of 44,900 bcm), is followed by Iran, Qatar, Australia, Saudi Arabia (which does not export and has 7700 bcm), the United States, Abu Dhabi, Nigeria, Venezuela and Nigeria, the last two with resources of more than 5000 bcm of gas.

- North America
- USA
- Canada
- South & Central America
- Venezuela
- Bolivia
- Argentina
- Trinidad & Tobago
- Mexico
- Brazil
- Peru
- Western Europe
- Norway
- Netherlands
- United Kingdom
- Germany
- Italy
- Eastern Europe and CIS
- Russia
- Turkmenistan
- Kazakhstan
- Uzbekistan
- Azerbaijan
- Ukraine
- Romania
- Africa
- Nigeria
- Algeria
- Egypt
- Libya
- Angola
- Middle East
- Irán
- Qatar
- Saudi Arabia
- Abu Dhabi
- Iraq
- Kuwait
- Oman
- Yemen
- China and India
- China
- Indonesia
- Australia
- Malaysia
- India
- Pakistan
- Papua-New Guinea
- Bangladesh
- Brunei
- TOTAL WORLD
- 7.044
- 4.451
- 1.593
- 7.378
- 4.287
- 757
- 542
- 532
- 419
- 326
- 325
- 6.462
- 3.159
- 1.449
- 826
- 191
- 125
- 295
- 53.743
- 44.840
- 2.680
- 1.900
- 1.745
- 1.275
- 1.040
- 14.078
- 5.117
- 4.545
- 1.869
- 1.491
- 270
- 72.544
- 27.500
- 25.783
- 6.834
- 5.660
- 3.170
- 1.572
- 690
- 479
- 13.884
- 2.020
- 2.650
- 2.587
- 2.272
- 923
- 798
- 428
- 422
- 343
- 175.133
- 7.617
- 5.977
- 1.640
- 7.592
- 4.705
- 710
- 446
- 481
- 392
- 348
- 335
- 6.364
- 3.022
- 1.316
- 684
- 155
- 94
- 628
- 53.766
- 44.855
- 2.680
- 1.910
- 1.755
- 1.275
- 1.030
- 14.388
- 5.207
- 4.504
- 1.985
- 1.491
- 270
- 73.361
- 27.575
- 25.636
- 7.154
- 6.030
- 3.170
- 1.780
- 690
- 485
- 14.743
- 2.449
- 3.000
- 2.421
- 2.371
- 1.075
- 847
- 435
- 383
- 331
- 177.831
- 8.364
- 6.730
- 1.634
- 7.719
- 4.838
- 710
- 442
- 479
- 373
- 365
- 355
- 6.167
- 2.961
- 1.266
- 647
- 137
- 84
- 628
- 53.859
- 44.900
- 2.680
- 1.950
- 1.755
- 1.285
- 1.030
- 14.571
- 5.292
- 4.504
- 2.060
- 1.495
- 270
- 73.887
- 28.000
- 25.600
- 7.300
- 6.030
- 3.170
- 1.784
- 690
- 488
- 15.459
- 3.000
- 3.000
- 2.362
- 2.347
- 1.055
- 850
- 435
- 374
- 343
- 180.026
- 9.168
- 7.468
- 1.700
- 7.916
- 4.982
- 710
- 399
- 500
- 359
- 365
- 415
- 6.101
- 2.985
- 1.236
- 625
- 95
- 69
- 629
- 54.231
- 44.900
- 3.000
- 1.950
- 1.745
- 1.359
- 1.020
- 14.775
- 5.292
- 4.504
- 2.170
- 1.540
- 310
- 75.184
- 29.050
- 25.580
- 7.570
- 6.030
- 3.170
- 1.784
- 690
- 490
- 16.371
- 3.090
- 3.280
- 3.145
- 2.330
- 1.065
- 843
- 442
- 344
- 350
- 183.746
- 9.534
- 7.686
- 1.848
- 7.882
- 5.129
- 710
- 360
- 410
- 346
- 364
- 414
- 6.038
- 2.985
- 1.222
- 532
- 137
- 51
- 629
- 58.882
- 44.900
- 3.000
- 1.950
- 1.745
- 1.359
- 1.020
- 14.810
- 5.324
- 4.504
- 2.170
- 1.539
- 312
- 77.117
- 30.634
- 25.792
- 7.718
- 6.030
- 3.170
- 1.788
- 690
- 490
- 20.486
- 4.133
- 3.280
- 11.532
- 2.330
- 1.065
- 800
- 442
- 475
- 350
- 194.749
- 4,0
- 2,9
- 8,7
- -0,4
- 3,0
- 0,0
- -9,8
- -18,0
- -3,6
- -0,3
- -0,2
- -1,0
- 0,0
- -1,1
- -14,9
- 44,2
- -26,1
- 0,0
- 8,6
- 0,0
- 0,0
- 0,0
- 0,0
- 0,0
- 0,0
- 0,2
- 0,6
- 0,0
- 0,0
- -0,1
- 0,6
- 2,6
- 5,5
- 0,8
- 2,0
- 0,0
- 0,0
- 0,2
- 0,0
- 0,0
- 25,1
- 33,8
- 0,0
- 266,7
- 0,0
- 0,0
- -5,1
- 0,0
- 38,1
- 0,0
- 6,0
- 4,9
- 3,9
- 0,9
- 4,0
- 2,6
- 0,4
- 0,2
- 0,3
- 0,2
- 0,2
- 0,2
- 3,1
- 1,5
- 0,6
- 0,3
- 0,1
- 0,0
- 0,3
- 30,2
- 23,1
- 1,5
- 1,0
- 0,9
- 0,7
- 0,5
- 7,6
- 2,7
- 2,3
- 1,1
- 0,8
- 0,2
- 39,6
- 15,7
- 13,2
- 4,0
- 3,1
- 1,6
- 0,9
- 0,4
- 0,3
- 10,5
- 2,1
- 1,7
- 5,9
- 1,2
- 0,5
- 0,4
- 0,2
- 0,2
- 0,2
- 100
Source: CEDIGAZ and Oil and Gas Journal. Prepared by Sedigas.
Some of the data available indicate that worldwide investment in exploration and drilling activities for new gas fields declined during 2009. The reasons for this were the low prices of the product on the market, the weakness of demand and the harshening of financial conditions. In the USA the forecasts of the Energy Information Administration for 2010 suggest a downturn in output of 4%.
New techniques such as horizontal drilling and hydraulic rock fractures are being employed for the production of non-conventional gas. Prospects for resources and output are very high, while methods of exploitation continue to progress. There does exist a degree of consensus within the scientific community as to the idea that the extraction technique known as depressurisation is the most cost-effective method.


