It should be remembered that in 2008 worldwide energy consumption rose by 1.4%, compared with an increase of 2.6% in 2007, according to data from BP (Statistical Review of World Energy). A downturn then began in the second half of 2008, in line with the evolution of economic indicators.
The estimate for worldwide energy consumption is for a level of 11.023 billion tonnes of oil equivalent (Toe).
Natural gas maintains its share of around 24% of primary energy consumption, without taking into consideration non-hydroelectric renewables, in accordance with the BP methodology. Coal may have increased its share by a fraction of a percentage point as a result of the continuing increase in use by major consumers (in particular China and India). Note: Chinese GDP grew by 8.7% in 2009.
- Coal
- Oil
- Natural gas
- Nuclear (3)
- Hydroelec.(4)
- WORLD TOTAL
- OECD
- 2.258,3
- 3.235,4
- 1.913,2
- 600,0
- 216,6
- 8.223,5
- 4.770,1
- 27,5
- 39,3
- 23,3
- 7,3
- 2,6
- 100,0
- 58,0
- 2.360,9
- 3.537,2
- 2.191,9
- 584,5
- 610,5
- 9.285,0
- 5.359,3
- 25,4
- 38,1
- 23,6
- 6,3
- 6,6
- 100,0
- 57,7
- 2.957,0
- 3.861,3
- 2.512,2
- 627,0
- 666,6
- 10.624,1
- 5.559,9
- 27,8
- 36,3
- 23,6
- 5,9
- 6,3
- 100,0
- 52,3
- 3.303,7
- 3.927,9
- 2.726,1
- 619,7
- 717,5
- 11.294,9
- 5.508,4
- 29,2
- 34,8
- 24,1
- 5,5
- 6,4
- 100,0
- 48,8
- 3.237,6
- 3.802,2
- 2.644,3
- 620,0
- 719,0
- 11.023,2
- 5.244,0
- 29,4
- 34,5
- 24,0
- 5,6
- 6,5
- 100,0
- 47,6
(2) Estimate
(3) (4) Calculation methodology modified by BP from its June 2002 report onwards. The new methodology (applied to every year of the series) assumes a value for nuclear and hydroelectric primary energy in terms equivalent to the energy required to generate the same quantity of electricity at a conventional power station, assuming a conversion efficiency of 38%.
Previously hydroelectric generation was considered as primary energy equivalent to the electricity produced, while for nuclear energy the efficiency factor used in the conversion was 33%.
One of the consequences of this change in a methodology is an increase in the total Primary energy consumption in every area and a reduction of the relative weighting of other energy sources, including natural gas.
This new methodology employed by BP is not used by Eurostat or the IEA, which, for hydroelectric and nuclear power, equate energy output at terminals to primary energy.
Source: BP Statistical Review of World Energy, Monthly Natural Gas Survey (IEA), Monthly Oil Survey (IEA) and prepared by Sedigas.
In the European Union, the figures suggest a downturn in total energy consumption in 2007 and 2008, following the plateau seen in 2006, in all cases in comparison with the previous year.
- North America
- USA
- Canada
- Central and Sur America
- Argentina
- Brazil
- Mexico
- Venezuela
- Chile
- Colombia
- Europe
- Germany
- Austria
- Belgium and Luxembourg
- Bulgaria
- Denmark
- Spain
- Finland
- France
- Greece
- Ireland
- Italy
- Netherlands
- Poland
- Portugal
- United Kingdom
- Czech Republic
- Romania
- Sweden
- CIS
- Russian Fed.
- Ukraine
- Middle East
- Iran
- Saudi Arabia
- Kuwait
- UAE
- Africa
- South Africa
- Egypt
- Algeria
- China and India
- Australia
- South Korea
- China
- India
- Japan
- Indonesia
- TOTAL WORLD
- OCDE
- 37,5
- 38,5
- 30,9
- 48,0
- 32,4
- 46,2
- 52,8
- 39,9
- 60,6
- 35,5
- 39,5
- 38,0
- 40,7
- 57,6
- 26,7
- 52,0
- 50,7
- 39,2
- 35,8
- 61,8
- 59,6
- 45,8
- 50,9
- 25,6
- 60,6
- 37,2
- 22,9
- 28,0
- 31,0
- 19,4
- 19,0
- 11,8
- 50,0
- 43,4
- 59,7
- 57,1
- 30,5
- 38,0
- 19,9
- 43,9
- 37,2
- 29,2
- 35,9
- 43,0
- 18,8
- 31,2
- 43,7
- 46,1
- 34,8
- 39,6
- 26,3
- 26,1
- 27,3
- 25,2
- 53,6
- 10,0
- 35,5
- 35,7
- 8,3
- 24,3
- 25,2
- 23,7
- 25,8
- 21,3
- 14,4
- 24,0
- 25,9
- 13,4
- 15,4
- 11,0
- 29,8
- 39,6
- 38,0
- 12,8
- 18,1
- 39,9
- 18,0
- 34,7
- 1,9
- 51,5
- 55,2
- 40,9
- 48,0
- 55,1
- 40,3
- 42,9
- 69,5
- 24,0
- 0,0
- 49,5
- 60,6
- 11,0
- 17,9
- 14,9
- 3,6
- 8,6
- 16,6
- 27,5
- 24,1
- 24,6
- 22,7
- 24,6
- 10,0
- 4,3
- 0,5
- 6,4
- 5,3
- 0,0
- 11,6
- 7,6
- 17,5
- 26,0
- 9,4
- 6,4
- 37,1
- 24,0
- 10,4
- 12,7
- 4,6
- 24,9
- 9,3
- 9,6
- 10,1
- 61,0
- 14,2
- 16,7
- 44,1
- 20,4
- 4,3
- 17,9
- 14,8
- 29,9
- 1,5
- 0,7
- 0,0
- 0,0
- 0,0
- 31,0
- 77,7
- 1,3
- 1,9
- 51,0
- 43,3
- 27,5
- 70,2
- 53,4
- 25,4
- 24,3
- 29,2
- 21,3
- 8,1
- 8,4
- 6,4
- 0,9
- 2,1
- 1,4
- 1,3
- 0,2
- 0,0
- 0,0
- 11,5
- 10,8
- 0,0
- 14,5
- 17,8
- 0,0
- 11,5
- 20,1
- 38,6
- 0,0
- 0,0
- 0,0
- 1,0
- 0,0
- 0,0
- 5,6
- 13,9
- 6,6
- 31,0
- 5,5
- 5,4
- 15,4
- 0,0
- 0,0
- 0,0
- 0,0
- 0,0
- 0,8
- 2,3
- 0,0
- 0,0
- 3,0
- 0,0
- 14,2
- 0,8
- 0,8
- 11,2
- 0,0
- 5,5
- 9,4
- 5,3
- 2,5
- 25,4
- 21,5
- 11,3
- 36,1
- 5,0
- 24,1
- 19,5
- 32,6
- 6,3
- 1,4
- 24,0
- 0,1
- 4,0
- 0,0
- 1,5
- 14,6
- 5,5
- 2,3
- 1,3
- 5,0
- 0,0
- 0,6
- 7,1
- 0,5
- 1,2
- 10,3
- 31,7
- 5,7
- 5,5
- 2,0
- 0,5
- 0,9
- 0,0
- 0,0
- 0,0
- 6,2
- 0,2
- 5,2
- 0,3
- 5,3
- 2,9
- 0,4
- 6,6
- 6,0
- 3,1
- 2,2
- 6,4
- 5,2
- 100,0
- 100,0
- 100,0
- 100,0
- 100,0
- 100,0
- 100,0
- 100,0
- 100,0
- 100,0
- 100,0
- 100,0
- 100,0
- 100,0
- 100,0
- 100,0
- 100,0
- 100,0
- 100,0
- 100,0
- 100,0
- 100,0
- 100,0
- 100,0
- 100,0
- 100,0
- 100,0
- 100,0
- 100,0
- 100,0
- 100,0
- 100,0
- 100,0
- 100,0
- 100,0
- 100,0
- 100,0
- 100,0
- 100,0
- 100,0
- 100,0
- 100,0
- 100,0
- 100,0
- 100,0
- 100,0
- 100,0
- 100,0
- 100,0
- 100,0
- 2.628,6
- 2.298,9
- 329,7
- 750,0
- 74,6
- 228,0
- 170,4
- 81,4
- 27,7
- 30,1
- 1.892,1
- 311,1
- 32,9
- 71,7
- 20,2
- 17,1
- 134,3
- 26,8
- 257,8
- 34,6
- 15,1
- 176,6
- 91,3
- 97,4
- 22,6
- 211,6
- 43,3
- 37,8
- 46,7
- 1.072,7
- 684,6
- 131,5
- 613,5
- 192,1
- 174,5
- 26,8
- 75,2
- 356,1
- 132,3
- 74,3
- 37,6
- 3.981,9
- 118,4
- 240,2
- 2.002,1
- 433,3
- 507,6
- 124,5
- 11.294,9
- 5.508,4
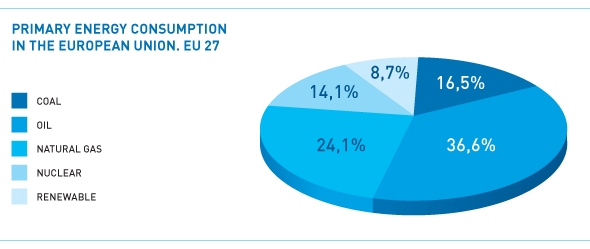
Most developed countries have increased their installed power and have future plans with ambitious target in this field. In fact, renewable energies were the only primary energy sources to see a clear increase in their role in energy demand across the OECD countries as a whole.
For some such energy sources, particularly wind power, technological advances are increasing efficiency and reducing costs at a heady pace. For marine generating plants (wind offshore) the prospects are considerable, with significant technological and regulatory advances. Despite the financial crisis, which is leading to a slowdown in the construction of marine wind farms in some countries (installed wind power amounted to 8600 MW by the end of 2009, only 1% higher than in 2008), forecasts are optimistic.
The Global Wind Energy Council (GWEC) announced in March 2009 the conclusions of its Annual Report, estimating that by 2013 installed wind power worldwide would amount to 332 GW, compared with 120 GW at the close of 2008.
Examples of the progress last year would be the start-up of an 11-turbine farm in Belgium in late November, with each generator having a power rating of 6 MW, the fact that China ended the year with twice the installed power it had at the close of 2008, and the development in Germany of the country's first marine wind farm.
Exports of subsidised biofuels into the EU continue to concern those countries which have committed to this renewable energy source. In late November it was announced that the European Biodiesel Board was preparing a formal complaint against the ongoing imports of biodiesel from the USA.
- Coal
- Oil
- Natural gas
- Nuclear
- Renewable
- TOTAL
- 319,5
- 676,5
- 446,0
- 257,4
- 121,6
- 1.821,0
- 17,5
- 37,1
- 24,5
- 14,1
- 6,7
- 100,0
- 325,1
- 673,1
- 438,0
- 255,3
- 129,9
- 1.821,4
- 17,8
- 37,0
- 24,0
- 14,0
- 7,1
- 100,0
- 331,2
- 656,9
- 432,4
- 241,3
- 141,0
- 1.802,8
- 18,4
- 36,4
- 24,0
- 13,4
- 7,8
- 100,0
- 312,7
- 647,0
- 444,1
- 239,1
- 144,3
- 1.787,2
- 17,5
- 36,2
- 24,8
- 13,4
- 8,1
- 100,0
- 285,0
- 630,0
- 415,2
- 242,0
- 150,0
- 1.722,2
- 16,5
- 36,6
- 24,1
- 14,1
- 8,7
- 100,0

(2) Estimate.
Source: Energy Yearly Statistics 2007 and Energy Monthly Statistics. Eurostat. European Commission. Luxembourg. 2009; Eurogas; Monthy Oil Survey (AIE) and prepared by Sedigas.
Most of the development plans of the new nuclear groups announced in 2008 are going ahead. For example, the British government specified in mid-April eleven possible sites for new power stations. The UK government has set a target of 2013 for the start of construction work on eight new power plants, which would be the first nuclear facilities to be built in the country for 23 years. In the second half of April China began construction of the first of its third-generation reactors. The country has plans to have 40 GW of nuclear power installed by 2020, compared with the current 9 GW.
Meanwhile, Germany will be postponing the shut-down of its nuclear programme, having prolonged the lifespan of a number of power plants. This operational extension of nuclear units up to 40 years is a pattern also seen in the USA and Belgium.
At a summit held in London in October, the World Energy Council (WEC) called on countries to increase nuclear energy output, a measure seen by them as one of the four cornerstones of the fight against climate change. Investment in technology, increases in energy efficiency and CO2 capture and storage are the other three key items.
- Industry
- Transport
- Residential-Commerc.
- TOTAL
- 331,6
- 352,3
- 475,9
- 1.159,8
- 28,6
- 30,4
- 41,0
- 100,0
- 332,2
- 360,7
- 480,1
- 1.173,0
- 28,3
- 30,8
- 40,9
- 100,0
- 325,8
- 363,2
- 483,3
- 1.172,3
- 27,8
- 31,0
- 41,2
- 100,0
- 319,5
- 371,1
- 484,9
- 1.175,5
- 27,2
- 31,6
- 41,3
- 100,0
- 322,9
- 377,2
- 457,6
- 1.157,7
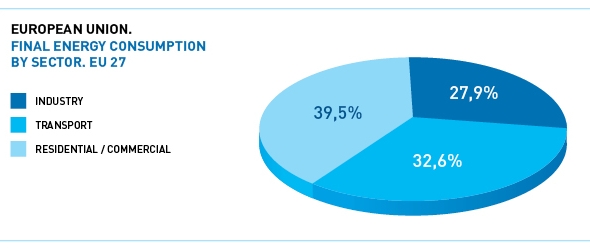
- 27,9
- 32,6
- 39,5
- 100,0

- Coal
- Oil Products
- Natural gas
- Hydraulic
- Nuclear
- Other (2)
- Where wind:
- TOTAL
- 982.375
- 145.985
- 616.041
- 357.147
- 1.008.437
- 177.581
- 58.815
- 3.287.566
- 29,9
- 4,4
- 18,7
- 10,9
- 30,7
- 5,4
- - -
- 100,0
- 969.244
- 138.973
- 660.980
- 341.388
- 997.699
- 200.663
- 70.486
- 3.308.947
- 29,3
- 4,2
- 20,0
- 10,3
- 30,2
- 6,1
- - -
- 100,0
- 987.108
- 131.685
- 681.668
- 344.614
- 989.877
- 219.002
- 82.306
- 3.353.954
- 29,4
- 3,9
- 20,3
- 10,3
- 29,5
- 6,5
- - -
- 100,0
- 988.367
- 112.483
- 725.097
- 343.768
- 935.277
- 256.702
- 104.259
- 3.361.694
- 29,4
- 3,3
- 21,6
- 10,2
- 27,8
- 7,6
- - -
- 100,0

(2) Wind, solar, geothermal, derivative gases, biomass and urban and industrial waste.
Source: Energy Yearly Statistics 2007. Eurostat. European Commission.. Luxembourg. 2009. Prepared by Sedigas.

-
 NATURGAS
 -
 MEDGAZ

