The world's gas
>
Estate of reserves
>
State of the reserves
State of the reserves
The figures published by Oil and Gas Journal at the end of the year showed insignificant growth in natural gas reserves, equivalent to 88 bcm (109), approximately.
The region which saw the most notable increase in reserves was America, where overall growth was about 5.3%. The largest decline was in Western Europe, with an estimated 5% fall.

Unión Fenosa
Proven world reserves of natural gas. Evolution (1)
(Billions of m3)
- North America
- Central and South America
- Western Europe
- Western Europe and CIS
- Africa
- Middle East
- Asia-Oceania
- *
1970
- 9,4
- 1,9
- 3,6
- 12,5
- 3,8
- 6,6
- 1,6
- 39,4
1975
- 8,5
- 2,4
- 4,1
- 24,2
- 5,2
- 15,3
- 3,4
- 63,1
1980
- 8
- 4,4
- 3,9
- 31,6
- 5,7
- 18,5
- 4,8
- 76,9
1985
- 8,4
- 5,4
- 5,7
- 38
- 5,9
- 25,9
- 7
- 96,3
1990
- 7,5
- 6,9
- 5,5
- 52,5
- 8,5
- 37,8
- 10,6
- 129,3
1995
- 6,5
- 7,8
- 6,2
- 58,9
- 9,9
- 44,7
- 13,1
- 147,1
2000
- 6,5
- 7,7
- 7,7
- 56,5
- 11,4
- 54,8
- 12,2
- 156,8
2005
- 7,1
- 7,4
- 6,1
- 57,5
- 14,1
- 72,5
- 13,8
- 178,5
2007
- 7,6
- 8,0
- 5,6
- 57,9
- 14,5
- 73,0
- 15,1
- 181,8
2008
- 7,8
- 8,7
- 5,3
- 57,9
- 14,6
- 72,5
- 15,0
- 181,9
(1) Figures for the beginning of each year.
Source: CEDIGAZ and Oil and Gas Journal. Own source.
Source: CEDIGAZ and Oil and Gas Journal. Own source.
The countries which have seen the sharpest upturn in natural gas reserves are Angola, Brazil, Malaysia and Bolivia. Downward revisions were largest in Italy, Papua-New Guinea and the United Kingdom. It should be borne in mind that forecasts of the above factor are only done in countries where new evaluation studies have been carried out (of which there are few).
PROVEN WORLD RESERVES OF NATURAL GAS. EVOLUTION BY COUNTRIES.109 m3. (1)
(Billons de m3)
- North America
- USA
- Canada
- Central and South America
- Venezuela
- Bolivia
- Argentina
- Trinidad and Tobago
- Mexico
- Brazil
- Peru
- Western Europe
- Norway
- The Netherlands
- UK
- Germany
- Italy
- Western Europe and CIS
- Russia
- Turkmenistán
- Kazajstan
- Uzbekistan
- Azerbaijan
- Ucrania
- Rumanía
- Africa
- Nigeria
- Argelia
- Egypt
- Libya
- Angola
- Middle East
- Iran
- Qatar
- Arabia Saudita
- Abu Dhabi
- Irak
- Kuwait
- Oman
- Yemen
- Asia-Oceania
- China
- Indonesia
- Australia
- Malasia
- India
- Paquistan
- Papua New Guinea
- Bangladesh
- Brunei
- WORLD TOTAL
2004
- 6.956
- 5.353
- 1.603
- 7.243
- 4.219
- 782
- 612
- 588
- 421
- 245
- 247
- 6.281
- 3.188
- 1.492
- 905
- 207
- 135
- 57.734
- 48.000
- 2.900
- 1.900
- 1.860
- 1.350
- 1.105
- 305
- 13.925
- 5.055
- 4.545
- 1.756
- 1.491
- 269
- 72.640
- 27.570
- 25.783
- 6.754
- 5.620
- 3.170
- 1.572
- 830
- 479
- 13.925
- 1.823
- 2.770
- 2.594
- 2.464
- 854
- 790
- 428
- 433
- 345
- 178.704
2005
- 7.051
- 5.451
- 1.600
- 7.378
- 4.287
- 757
- 542
- 532
- 419
- 326
- 325
- 6.091
- 3.159
- 1.449
- 826
- 191
- 125
- 57.532
- 47.800
- 2.860
- 1.900
- 1.860
- 1.350
- 1.110
- 295
- 14.118
- 5.117
- 4.545
- 1.869
- 1.491
- 270
- 72.544
- 27.500
- 25.783
- 6.834
- 5.660
- 3.170
- 1.572
- 690
- 479
- 13.819
- 2.020
- 2.769
- 2.403
- 2.272
- 923
- 798
- 428
- 422
- 343
- 178.533
2006
- 7.427
- 5.787
- 1.640
- 7.264
- 4.315
- 740
- 439
- 530
- 412
- 306
- 338
- 5.850
- 3.108
- 1.387
- 728
- 178
- 117
- 57.863
- 47.820
- 2.860
- 1.900
- 1.850
- 1.350
- 1.100
- 628
- 14.280
- 5.154
- 4.504
- 1.895
- 1.491
- 270
- 72.488
- 27.495
- 25.636
- 6.900
- 5.700
- 3.170
- 1.572
- 690
- 479
- 14.455
- 2.270
- 2.769
- 2.429
- 2.480
- 1.101
- 852
- 428
- 407
- 340
- 179.627
2007
- 7.625
- 5.977
- 1.648
- 8.034
- 5.100
- 740
- 446
- 480
- 392
- 348
- 335
- 5.593
- 3.022
- 1.316
- 684
- 155
- 94
- 57.875
- 47.814
- 2.860
- 1.900
- 1.870
- 1.350
- 1.100
- 628
- 14.493
- 5.215
- 4.504
- 2.047
- 1.491
- 270
- 73.031
- 27.575
- 25.636
- 7.154
- 5.700
- 3.170
- 1.780
- 690
- 485
- 15.153
- 3.000
- 2.659
- 2.485
- 2.480
- 1.075
- 865
- 435
- 392
- 331
- 181.804
2008
- 7.828
- 6.173
- 1.655
- 8.674
- 5.565
- 817
- 437
- 480
- 376
- 395
- 319
- 5.320
- 2.905
- 1.316
- 585
- 155
- 54
- 57.874
- 47.814
- 2.860
- 1.900
- 1.870
- 1.350
- 1.100
- 628
- 14.648
- 5.275
- 4.428
- 2.047
- 1.419
- 1.287
- 72.543
- 26.455
- 25.490
- 7.546
- 5.700
- 3.168
- 1.813
- 690
- 485
- 15.005
- 3.000
- 2.553
- 2.455
- 2.745
- 1.075
- 865
- 285
- 392
- 331
- 181.892
Var..(%)
- 2,7
- 3,3
- 0,4
- 8,0
- 9,1
- 10,4
- -2,0
- 0,0
- -4,1
- 13,5
- -4,8
- -4,9
- -3,9
- 0,0
- -14,5
- 0,0
- -42,6
- 0,0
- 0,0
- 0,0
- 0,0
- 0,0
- 0,0
- 0,0
- 0,0
- 1,1
- 1,2
- -1,7
- 0,0
- -4,8
- 376,7
- -0,7
- -4,1
- -0,6
- 5,5
- 0,0
- -0,1
- 1,9
- 0,0
- 0,0
- -1,0
- 0,0
- -4,0
- -1,2
- 10,7
- 0,0
- 0,0
- -34,5
- 0,0
- 0,0
- 0,0
Dist.(%)
- 4,3
- 3,4
- 0,9
- 4,8
- 3,1
- 0,4
- 0,2
- 0,3
- 0,2
- 0,2
- 0,2
- 2,9
- 1,6
- 0,7
- 0,3
- 0,1
- 0,0
- 31,8
- 26,3
- 1,6
- 1,0
- 1,0
- 0,7
- 0,6
- 0,3
- 8,1
- 2,9
- 2,4
- 1,1
- 0,8
- 0,7
- 39,9
- 14,5
- 14,0
- 4,1
- 3,1
- 1,7
- 1,0
- 0,4
- 0,3
- 8,2
- 1,6
- 1,4
- 1,3
- 1,5
- 0,6
- 0,5
- 0,2
- 0,2
- 0,2
- 100
(1) Only the countries with the highest reserves in each area are included. Figures for the beginning of each year.
Source: CEDIGAZ and Oil and Gas Journal. Own source.
Source: CEDIGAZ and Oil and Gas Journal. Own source.
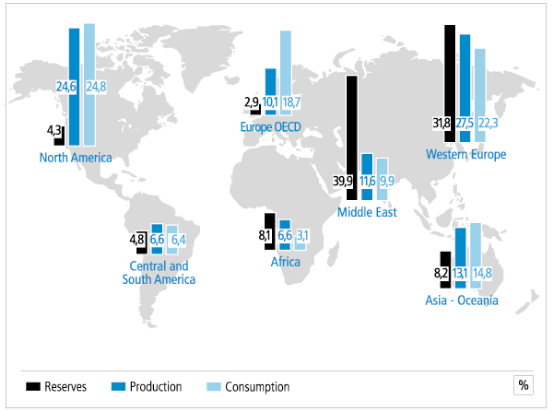
The Middle East has 40% of the world’s reserves, followed by Eastern Europe and the countries of the CIS, at 32%, in round figures.
The Russian Federation has the largest known reserves in the world, assessed at 47,800 bcm of gas, 26.3% of the world total.
Iran is second, with 14.5% of the reserves, followed by Qatar (14%), Saudi Arabia (4.1%), Abu Dhabi (3.1%), Venezuela (3%) and Nigeria, with 5,275 bcm of natural gas, equivalent to 2.9% of the world reserves. 
Iberdrola Endesa Enagas
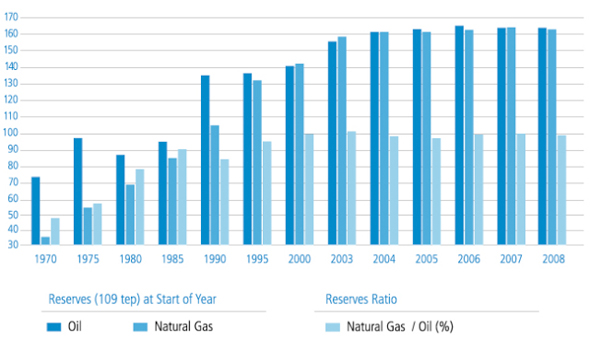
EVOLUTION OF OIL AND NATURAL GAS RESERVES IN THE WORLD

Source: BP, CEDIGAZ and Oil and Gas Journal. Own source.
ResThe USA is ranked fifth (3.4%), and it is important to note that the number of natural gas prospections rose because of the price increase in the period 2005-2006, leading to the discovery of new reserves.
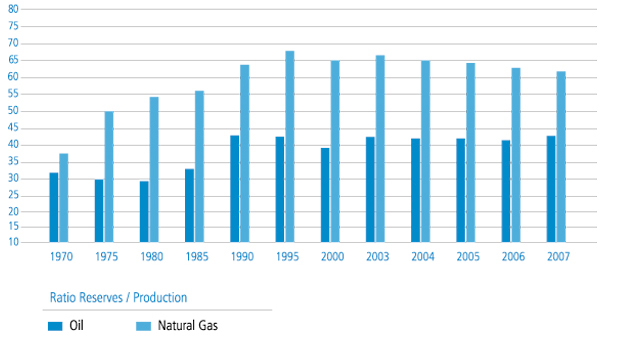
Taking only the known deposits, present reserves ensure there will be enough natural gas in the world for about 62 years.
The recorded gas reserves at the end of 2007 were equivalent to a little over 98% of the crude reserves. NATURAL GAS AND OIL. RATIO RESERVES/PRODUCTION.

DISTRIBUTION OF WORLD RESERVES, PRODUCTION AND CONSUMPTION OF NATURAL GAS (%)

Annual
Report
07
Annual Report 2.007: Sedigas - The Spanish Gas Association

